The Silent Failures in Agentic Data Science
Abstract
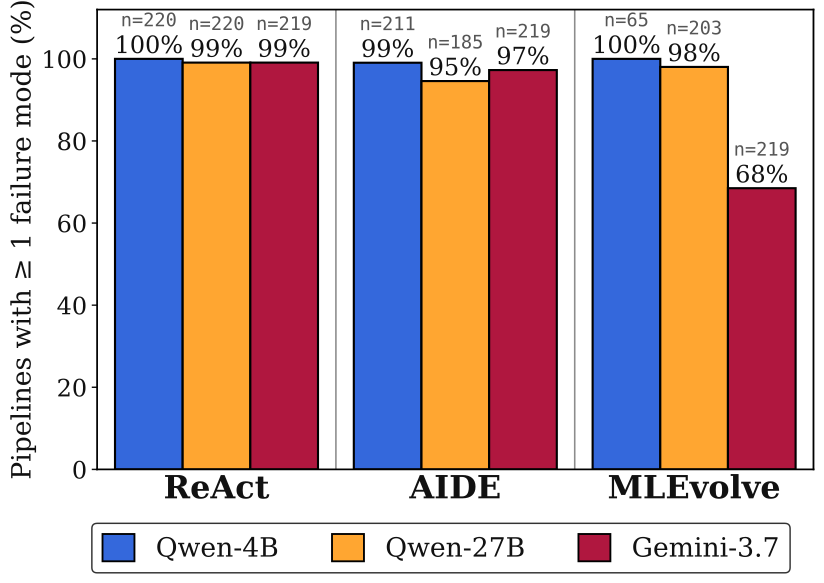
Large language models have significantly lowered the barrier to writing code. Naturally, this has also led to the development of data science agents that promise automating the design and execution of data science from task formulation to model development. Existing evaluations of agentic data science (agentic DS) assess downstream predictive performance and code correctness, providing preliminary insight in agentic DS capabilities. We argue that these evaluations overlook the fundamental principles of data science: methodological data science- and domain knowledge. As such, only assessing downstream performance masks methodological failures such as data leakage and inappropriate validation, limiting the development of robust agentic DS systems. In this paper, we evaluate agentic DS beyond accuracy from three different angles: 1) a large-scale analysis of failure modes in common agentic DS frameworks and models across 220 data science tasks, 2) a reusable and extensible test suite with curated data science tasks that test for six specific failures in a controlled manner, and 3) a qualitative assessment of agentic DS pipelines against expert solutions on Kaggle competitions.
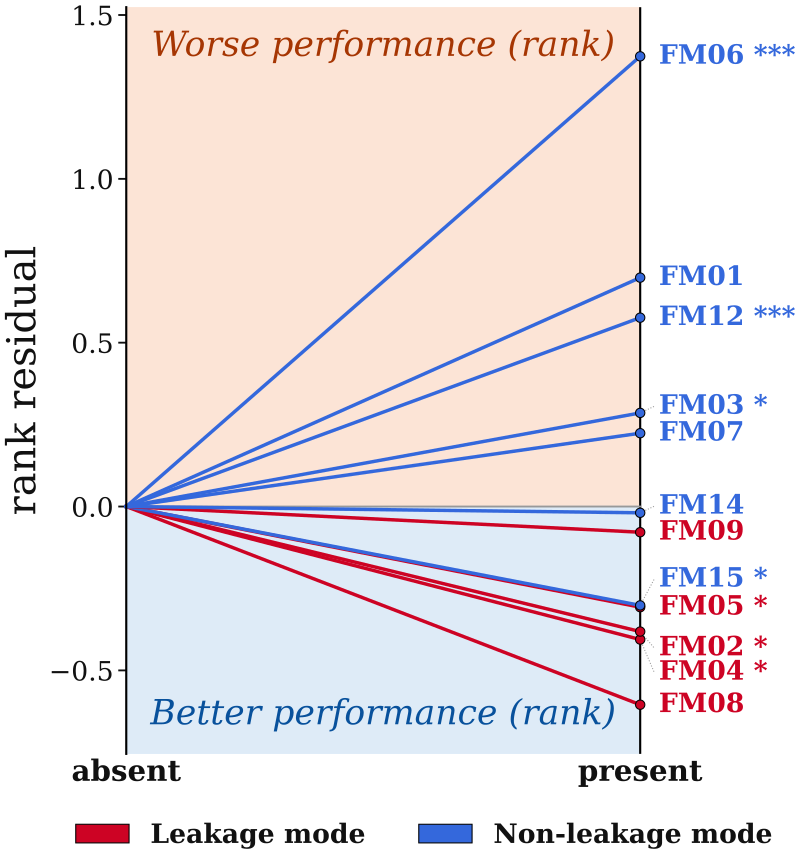
We find that the majority of agentic solutions contain at least one failure mode despite the complexity of agentic harness or model capacity. Moreover, we identify a positive correlation between the occurrence of data leakage failures and predictive performance, confirming the necessity to evaluate agents beyond accuracy. Our qualitative analysis shows that DS agents generally lack problem solving creativity and domain knowledge, compared to competition-winning data scientists. We believe that principled failure mode analysis, as presented here, should be integral part of agentic DS evaluations, and that the insights we surface will be key in developing trustworthy agentic DS pipelines.
Key findings
Which failure modes are most common?Breaking failures down by mode shows which mistakes each agent and model makes most often.
| Failure mode | ReAct | AIDE | MLEvolve | ||||||
|---|---|---|---|---|---|---|---|---|---|
| Qwen-4B | Qwen-27B | Gemini-3.7 | Qwen-4B | Qwen-27B | Gemini-3.7 | Qwen-4B | Qwen-27B | Gemini-3.7 | |
| FM01Wrong task formulation | 0.02 | 0.01 | 0.02 | 0.01 | 0.03 | 0.01 | 0.02 | 0.01 | 0.00 |
| FM02Peeking at test data during EDAleak | 0.01 | 0.12 | 0.07 | 0.02 | 0.08 | 0.15 | 0.02 | 0.08 | 0.10 |
| FM03Not cleaning data | 0.28 | 0.04 | 0.30 | 0.72 | 0.21 | 0.45 | 0.86 | 0.17 | 0.10 |
| FM04Imputation before splittingleak | 0.00 | 0.13 | 0.06 | 0.08 | 0.03 | 0.13 | 0.09 | 0.03 | 0.10 |
| FM05Ignoring temporal orderleak | 0.00 | 0.36 | 0.48 | 0.13 | 0.15 | 0.47 | 0.02 | 0.17 | 0.36 |
| FM06No train/val split | 1.00 | 0.05 | 0.40 | 0.07 | 0.01 | 0.00 | 0.69 | 0.01 | 0.00 |
| FM07No feature engineering | 0.98 | 0.50 | 0.38 | 0.93 | 0.71 | 0.12 | 0.94 | 0.16 | 0.00 |
| FM08Scaling before splittingleak | 0.00 | 0.00 | 0.00 | 0.02 | 0.00 | 0.03 | 0.02 | 0.00 | 0.01 |
| FM09Feature selection before splittingleak | 0.00 | 0.03 | 0.08 | 0.00 | 0.02 | 0.14 | 0.00 | 0.01 | 0.06 |
| FM10Wrong model type for task | 0.01 | 0.00 | 0.00 | 0.03 | 0.00 | 0.00 | 0.00 | 0.00 | 0.00 |
| FM11No regularisation in DL | – | – | – | – | – | – | – | 0.00 | 0.00 |
| FM12Naive ensembling | – | 0.49 | 0.90 | – | 0.81 | 0.46 | – | 0.51 | 0.04 |
| FM13Reusing test set across variantsleak | – | 0.00 | – | – | – | 0.00 | – | 0.06 | 0.01 |
| FM14Single eval of stochastic model | 0.48 | 0.95 | 0.04 | 0.19 | 0.08 | 0.03 | 1.00 | 0.76 | 0.13 |
| FM15Using only one eval metric | 0.15 | 0.89 | 0.14 | 0.87 | 0.85 | 0.88 | 0.34 | 0.87 | 0.43 |
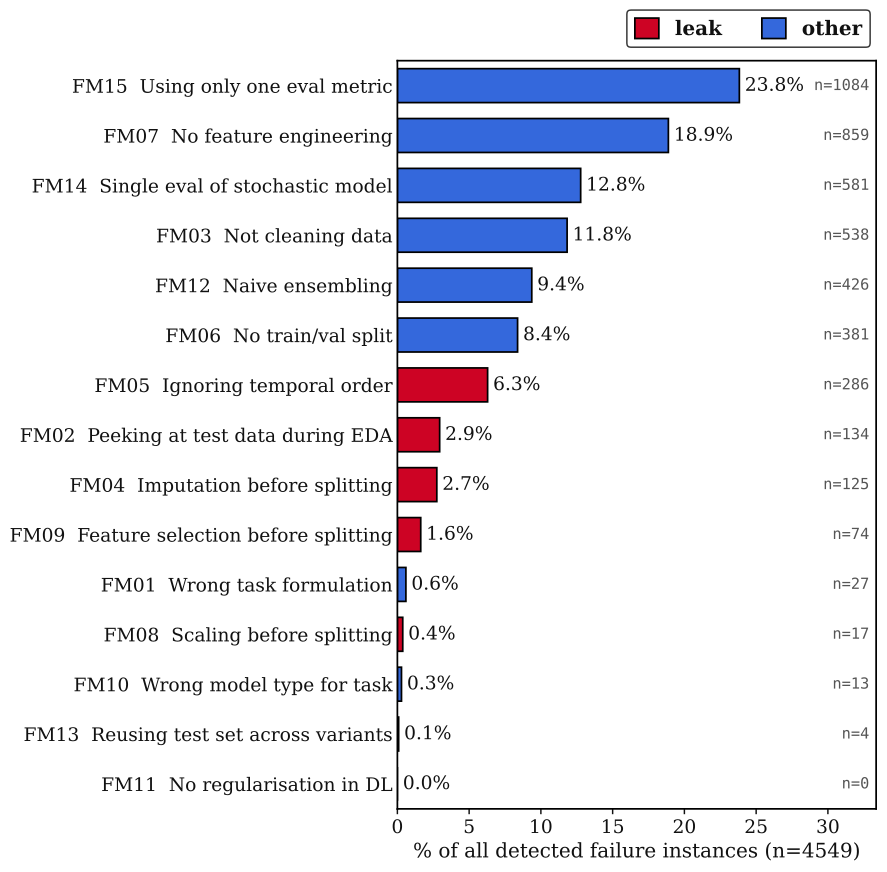
Leakage failure modes are associated with better predictive performance, while non-leakage failures go with worse performance. Predictive performance alone masks the silent failures.
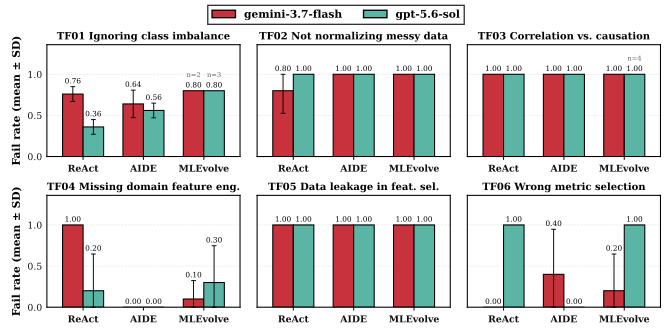
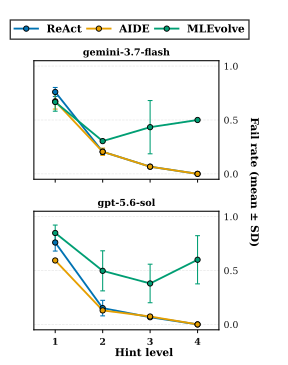
Six curated tasks each probe one specific failure. More explicit hints lower fail rates for ReAct and AIDE, but not consistently for MLEvolve.
On five Kaggle challenges, no agent beats the 1st-place human solution on either the private or the public leaderboard.
| Data science agents | AutoML | Baseline | ||||
|---|---|---|---|---|---|---|
| Challenge | Metric | ReAct | AIDE | MLEvolve | AutoGluon | 1st place (human) |
| Single-Cell Perturbations | MRRMSE ↓ | 1.1020 / 0.7690 | 0.8970 / 0.6600 | 0.8310 / 0.6170 | – / – | 0.7290 / 0.5230 |
| Heart Disease Prediction | AUC-ROC ↑ | 0.9547 / 0.9531 | 0.9549 / 0.9533 | 0.9546 / 0.9531 | 0.9551 / 0.9536 | 0.9554 / 0.9542 |
| Obesity Risk | Accuracy ↑ | 0.9065 / 0.9090 | 0.9059 / 0.9025 | 0.9071 / 0.9035 | 0.9074 / 0.9075 | 0.9116 / 0.9234 |
| Problematic Internet Use | QWK ↑ | 0.4440 / 0.4680 | 0.4280 / 0.4640 | 0.4170 / 0.4480 | – / – | 0.4820 / 0.5010 |
| Survival Predictions | C-index ↑ | 0.6502 / 0.6465 | 0.6536 / 0.6488 | 0.3155 / 0.3233 | – / – | 0.7013 / 0.6981 |




Contact
We welcome questions and suggestions. Reach out to effy.li@cwi.nl. (Links for paper and code are coming soon).